Primary wastewater sludge samples are collected every day at the East Shore Water Pollution Abatement Facility, which serves 200,000 people in the cities of New Haven, Hamden, East Haven, and Woodbridge, CT. It takes about four hours to perform virus concentration analysis. Viral RNA and DNA is extracted from primary sludge samples and purified using an automated extraction robot that incorporates magnetic bead separation technology. Pathogen concentrations are then quantified via droplet digital polymerase chain reaction. Data is updated on this website once per week and also goes into databases that are accessible to Yale University, the New Haven Department of Public Health, and Yale New Haven Hospital.
DATA INTERPRETATION
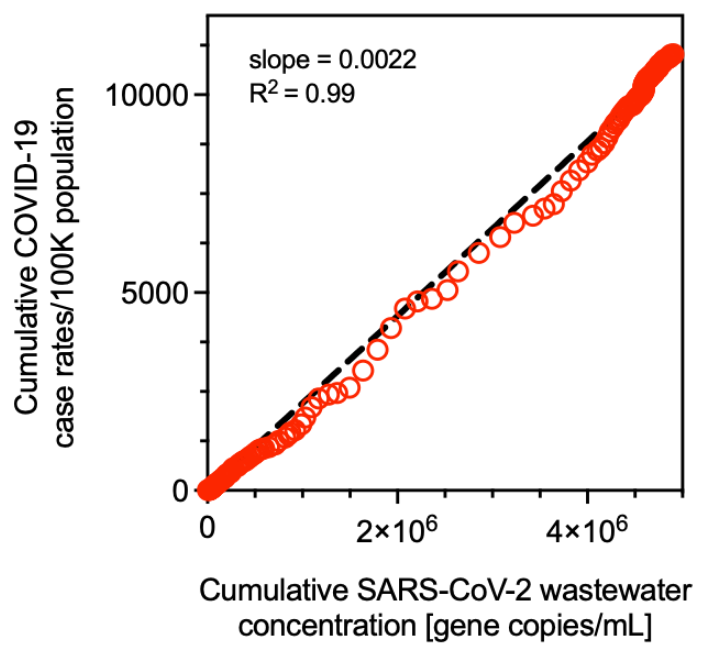
The concentration of viral pathogens in domestic wastewater is mathematically related to the number of infected individuals in the community served by the wastewater treatment plant. This relationship is typically linear (see plot below), but models can become a little more complex when considering the limited clinical data on the epidemiology of many diseases, and the time lags between when an infected individual sheds pathogens into wastewater and when a disease is diagnosed. When these two signals are correlated, it allows us to estimate the number of infected individuals from wastewater virus concentrations.
The ability to estimate the number of infected individuals from wastewater concentrations is an important advancement because wastewater surveillance has three distinct advantages over tracking cases by clinical testing. First, wastewater surveillance is hundreds of times less expensive than individual clinical testing. For example, in New Haven, CT, one sample each day provides information on the infectious diseases status of over 200,000 people. Second, for most diseases, clinical surveillance information either doesn’t exist or isn’t publicly available. Third, clinical surveillance data only captures a small fraction of actual cases, whereas wastewater catches everything and provides a more accurate picture of the daily dynamics of infectious disease.
More information about relating wastewater concentrations to the number of community infections can be found here:
- Models to estimate case rates from wastewater virus concentrations
- Estimating the true number of infections from wastewater data
- Lag time between reported case rates and wastewater concentrations
- Estimating hospitalizations from wastewater data
- Quantitative SARS-CoV-2 variant analysis through wastewater surveillance